In scientific experimentation, analytical chemistry, pharmaceutical manufacturing, and financial risk engineering, measuring variation is just as vital as measuring average magnitude. If an analytical chemist runs six replicate injections of a drug formulation and observes a standard deviation of ±0.5 mg, that number sounds impressively small. But whether ±0.5 mg represents world-class precision or unacceptable instability depends entirely on the average concentration: for a 500 mg active dose, ±0.5 mg is negligible (0.1% variation), whereas for a 1.0 mg pediatric dose, that same ±0.5 mg represents a disastrous 50% formulation error.
This fundamental limitation of raw standard deviation is why Relative Standard Deviation (%RSD)—also known universally as the percentage Coefficient of Variation (%CV)—is the global gold standard for repeatability and precision. However, despite its widespread use in standard operating procedures (SOPs), common calculation errors persist. Analysts frequently fall into the N - 1 degrees of freedom trap, confuse decimal CV with percentage RSD, misjudge acceptable regulatory thresholds under USP <621> or ICH guidelines, or struggle when datasets contain near-zero means. This comprehensive guide breaks down the mathematics, regulatory benchmarks, and practical proofs needed to calculate your numbers with complete confidence.
Quick answer:To calculate Relative Standard Deviation (%RSD), divide the sample standard deviation (s) by the absolute value of the sample mean (|x̄|) and multiply by 100%: %RSD = (s / |x̄|) × 100%. For experimental replicates and laboratory batches, standard deviation MUST be calculated using Bessel's correction with N - 1 degrees of freedom [s = √[Σ(x_i - x̄)² / (N - 1)]], NOT population N. In analytical chromatography (USP <621>), system suitability typically requires %RSD ≤ 1.0% to 2.0% across 5 to 6 replicate injections.
1. The Fundamental Mathematics: Standard Deviation vs. Relative Standard Deviation (%RSD)
Why raw standard deviation fails scale-independent comparisons
Standard deviation (s) is an absolute measure of data dispersion expressed in the exact same physical units as the raw measurements (grams, milliliters, peak area counts, or dollars). While essential for understanding distribution width around the mean, standard deviation cannot be used to compare repeatability across different concentrations, instruments, or units of measurement.
Relative Standard Deviation (%RSD) solves this scale dependency by dividing the standard deviation by the arithmetic mean and multiplying by 100%. The physical units cancel out entirely, leaving a dimensionless percentage that quantifies precision relative to the signal strength.
The algebraic equation for Relative Standard Deviation is formulated as:
The Relative Standard Deviation (%RSD) Formula
%RSD = (s / |x̄|) × 100% where: s = Sample Standard Deviation, x̄ = Sample Arithmetic Mean, |x̄| = Absolute value of Mean.
- s (Sample Standard Deviation): Quantifies the average spread of observations around the sample mean, calculated using Bessel's correction (N - 1 in the denominator).
- x̄ (Sample Mean): The arithmetic center of the dataset, calculated as Σx / N.
- |x̄| (Absolute Value): Guarantees that %RSD remains a positive dispersion percentage even in financial, engineering, or thermodynamic datasets with negative average values.
- Coefficient of Variation (CV): The unmultiplied decimal fraction (s / |x̄|). Multiplying CV by 100% yields %RSD. Thus, CV = 0.015 equals %RSD = 1.5%.
2. The #1 User Trap: Sample (N - 1) vs. Population (N) Degrees of Freedom
Why using N instead of N - 1 invalidates laboratory validation audits
By far the most common and costly mistake in laboratory data analysis is calculating standard deviation using the population formula (dividing by N) rather than the sample formula (dividing by N - 1).
When you run 3, 5, or 6 replicate injections on an HPLC or weigh 10 tablets from a 100,000-unit batch, you are evaluating an infinitesimal sample of an infinite hypothetical population. Because the sample mean (x̄) is mathematically computed from the sample points themselves, the points are clustered slightly closer to x̄ than they are to the true, unknown population mean (μ).
Dividing by N artificially underestimates variance. In 1815, mathematician Friedrich Bessel proved that dividing the sum of squared deviations by N - 1 (Bessel's correction) perfectly neutralizes this negative bias, providing an unbiased estimator of true process variability.
Audit Alert: False Validation Passes
Notice that on a standard 6-replicate HPLC system suitability run, using population N artificially reduces your calculated standard deviation by 8.7%. An assay with a true %RSD of 2.15% (which fails USP <621> ≤ 2.0%) will mistakenly appear as 1.96% if calculated with N. During a regulatory audit (FDA, EMA, TGA), re-running the data with N - 1 will trigger an automatic Out-of-Specification (OOS) violation and batch rejection.
| Replicates (N) | Degrees of Freedom (N - 1) | Sample Divisor | Population Divisor | Under-Estimation Bias if N is Used |
|---|---|---|---|---|
| 3 (Triplicate) | 2 | 2 | 3 | -18.4% (Catastrophic) |
| 4 (Quadruplicate) | 3 | 3 | 4 | -13.4% (Severe) |
| 5 (Standard Prep) | 4 | 4 | 5 | -10.6% (Audit Failure) |
| 6 (HPLC System Suitability) | 5 | 5 | 6 | -8.7% (Fails USP <621>) |
| 10 (Content Uniformity) | 9 | 9 | 10 | -5.1% (Material Error) |
| 20 (Process Capability) | 19 | 19 | 20 | -2.5% (Detectable Drift) |
| 50 (Bulk Run) | 49 | 49 | 50 | -1.0% (Approaching Asymptote) |
3. Regulatory & Industry Acceptance Thresholds (USP, ICH, FDA & ISO)
How to interpret whether your %RSD passes or fails
Unlike arbitrary statistical tests, regulated industries establish strict numeric %RSD criteria that dictate whether a batch can be released for human consumption or commercial distribution. Below are the definitive regulatory benchmarks:
| Regulatory Body / Standard | Domain / Application | Sample Size (N) | Maximum Allowable %RSD Threshold | Action if Exceeded |
|---|---|---|---|---|
| USP <621> Chromatography | HPLC/GC System Suitability (Assay) | 5 or 6 replicates | ≤ 1.0% or ≤ 2.0% (method specific) | Halt sequence; reinject or service column |
| USP <905> Uniformity of Dosage | Solid Oral Dosage Units (Tablets/Capsules) | 10 to 30 units | ≤ 6.0% (Acceptance Value L1 ≤ 15.0) | Perform Tier-2 testing (20 additional units) |
| ICH Q2(R1) / FDA Guidance | Analytical Method Validation (Repeatability) | 6 replicates or 3x3 | ≤ 2.0% for Drug Substance / Product | Method validation failure; re-optimize |
| ICH M10 Bioanalytical | Biological Fluids (PK / Bioequivalence) | 6 replicates per QC level | ≤ 15.0% (≤ 20.0% at LLOQ) | Batch run rejection; re-assay samples |
| ISO 5725 Accuracy / Precision | Inter-laboratory Collaborative Trials | Varies | ≤ 5.0% for chemical test methods | Investigate inter-lab reproducibility drift |
| EPA Clean Water Methods | Trace Heavy Metals & Environmental Contaminants | 4 to 7 replicates | ≤ 10.0% to 20.0% (analyte dependent) | Re-calibrate mass spectrometer / ICP-MS |
4. Handling Statistical Edge Cases: Zero, Negative, and Near-Zero Means
When the %RSD formula breaks down and alternative metrics are required
While %RSD is an exceptional tool for positive analytical measurements, it possesses mathematical boundary conditions that every practitioner must recognize:
1. When the Mean Equals Zero: Division by zero is mathematically undefined. If the average of your dataset is 0.00, %RSD cannot be computed. In physical sciences, this occurs when measuring net change, temperature differentials (ΔT), or baseline zero-point calibrations.
2. When the Mean is Near Zero: If the mean is an extremely tiny fraction (e.g., 0.0002) while standard deviation is 0.01, dividing by the near-zero mean causes %RSD to explode to thousands of percent. In such trace applications, reporting raw standard deviation (s) or Signal-to-Noise Ratio (S/N) is statistically superior.
3. Negative Values: If measuring financial portfolio profit/loss, Celsius temperatures, or delta-potential voltages, the arithmetic mean may be negative. By mathematical convention, analysts take the absolute value |x̄| in the denominator to avoid reporting a negative %RSD, since variation represents dispersion and cannot be negative.
Alternative Metrics for Zero-Mean Datasets
When data centers around zero, replace %RSD with Median Absolute Deviation (MAD) or the interquartile range (IQR) to avoid explosive denominator instability.
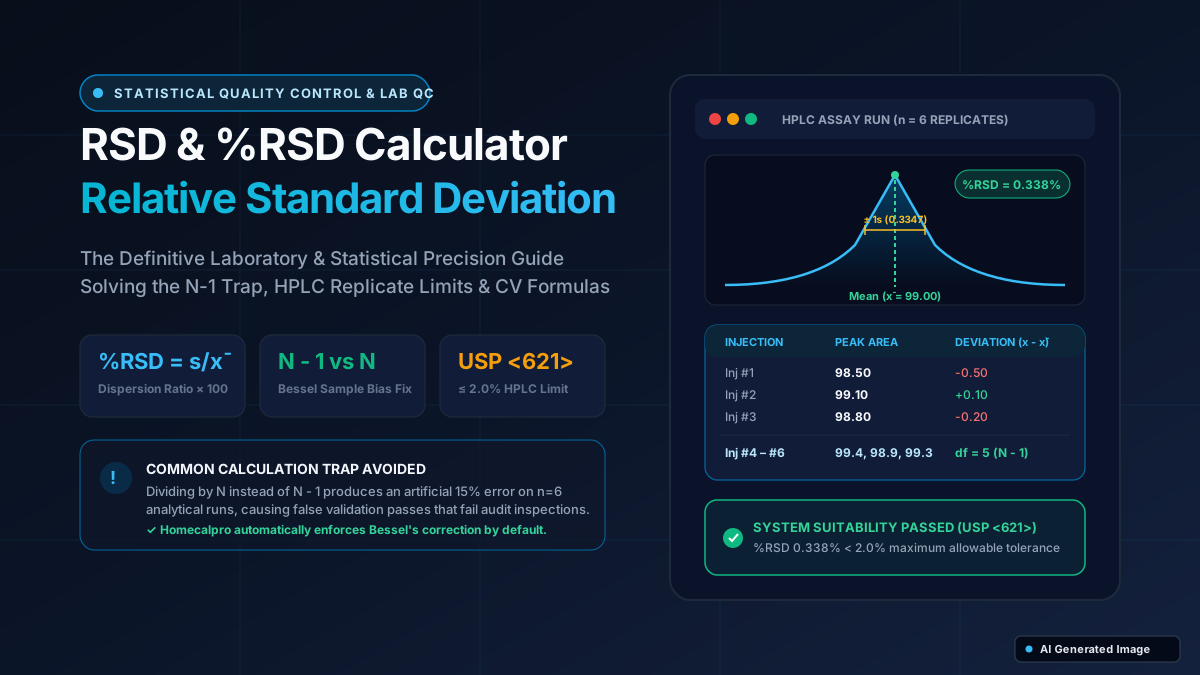
5. Step-by-Step Lab Case Study: HPLC Assay System Suitability (6 Replicates)
Complete arithmetic proof from raw peak area counts to final %RSD
Conclusion: The calculated %RSD of 0.3381% easily satisfies the USP <621> system suitability threshold of ≤ 2.0%. The instrument and column repeatability are certified for production batch analysis.
- Step 1: Calculate the Arithmetic Mean (x̄). Sum = 98.50 + 99.10 + 98.80 + 99.40 + 98.90 + 99.30 = 594.00. Mean x̄ = 594.00 / 6 = 99.00 mAU*s.
- Step 2: Calculate Deviations from the Mean (x_i - x̄). (98.50 - 99.00 = -0.50), (99.10 - 99.00 = +0.10), (98.80 - 99.00 = -0.20), (99.40 - 99.00 = +0.40), (98.90 - 99.00 = -0.10), (99.30 - 99.00 = +0.30).
- Step 3: Sum the Squared Deviations (SS). (-0.50)² + (0.10)² + (-0.20)² + (0.40)² + (-0.10)² + (0.30)² = 0.25 + 0.01 + 0.04 + 0.16 + 0.01 + 0.09 = 0.56.
- Step 4: Compute Sample Variance (s²) using N - 1. Degrees of freedom df = 6 - 1 = 5. Variance s² = 0.56 / 5 = 0.1120.
- Step 5: Compute Sample Standard Deviation (s). s = √0.1120 = 0.334664 mAU*s.
- Step 6: Compute Relative Standard Deviation (%RSD). %RSD = (0.334664 / 99.00) × 100% = 0.33804% ≈ 0.3381%.
6. Precision Metrics Matrix: Standard Deviation vs. %RSD vs. Variance vs. SEM
A side-by-side guide to choosing the right statistical metric
Selecting the wrong dispersion metric in a scientific report or manufacturing dashboard leads to confusion. Here is the definitive reference matrix explaining when to use each measure:
| Metric Name | Symbol | Formula | Units | Primary Strengths & Applications |
|---|---|---|---|---|
| Relative Standard Deviation | %RSD | (s / |x̄|) × 100% | Percentage (%) | Scale-independent precision; assay repeatability, method validation, quality control comparisons. |
| Coefficient of Variation | CV | s / |x̄| | Dimensionless decimal | Exact mathematical equivalent of %RSD expressed in decimal form; preferred in econometrics and biostatistics. |
| Sample Standard Deviation | s | √[ Σ(x - x̄)² / (N - 1) ] | Same as measured data | Quantifies actual physical spread in real units; essential for setting absolute specification limits (e.g. ±2 mg). |
| Sample Variance | s² | Σ(x - x̄)² / (N - 1) | Squared measurement units | Additive mathematical property; foundational for ANOVA (Analysis of Variance) and regression modeling. |
| Standard Error of the Mean | SEM | s / √N | Same as measured data | Quantifies how accurately the sample mean estimates the true population mean; shrinks as N increases. |
Frequently Asked Questions
Click any question below to expand quick answers, formulas, and expert tips.
How do I calculate %RSD in Excel or Google Sheets?
In Microsoft Excel or Google Sheets, calculate %RSD for a range of cells (e.g., A1:A6) using the formula: =(STDEV.S(A1:A6)/AVERAGE(A1:A6))*100. Always ensure you use STDEV.S (which divides by N - 1 for samples), NOT STDEV.P (which divides by N for populations).
What is considered a good or acceptable %RSD in chemistry?
For finished drug substance and product assay testing by HPLC/GC, an acceptable %RSD is typically ≤ 1.0% to 2.0%. For dissolution testing, %RSD up to 5.0% or 10.0% is common due to hydrodynamic tablet disintegration variability. In trace bioanalysis (ICH M10), %RSD up to 15.0% (and 20.0% at LLOQ) is fully acceptable.
Is %RSD the same as the Coefficient of Variation (CV)?
Yes, %RSD and CV describe the exact same mathematical relationship (standard deviation divided by mean). By standard convention, CV is often written as a decimal fraction (e.g., 0.025), while %RSD is explicitly multiplied by 100 and expressed with a percent sign (e.g., 2.5%).
Why should I not use %RSD when data contains negative numbers?
While taking the absolute value |x̄| avoids negative percentages, %RSD becomes mathematically misleading if the mean crosses or approaches zero. For example, if a temperature dataset ranges from -5°C to +5°C with a mean of 0.1°C, %RSD will approach thousands of percent even though physical variability is small. Use raw standard deviation or range for zero-crossing data.
Can %RSD exceed 100%?
Yes. Whenever the standard deviation is larger than the arithmetic mean (s > x̄), %RSD exceeds 100%. This is frequently observed in right-skewed distributions, such as customer lifetime value (LTV), financial loss severity, or trace bacterial colony counts.
How does increasing replicate count (N) affect %RSD?
As sample size N increases, the calculated sample mean and standard deviation converge toward the true population parameters, dramatically narrowing the confidence interval of your %RSD. Running 6 replicates gives significantly higher statistical confidence than a triplicate (N = 3).
How should suspected outliers be handled before calculating %RSD?
In regulated GxP environments, never delete an outlier without a documented root-cause investigation (e.g., bubble in the flow cell or pipette tip leak). If no assignable cause is found, statistical tests like Grubbs' Test (for single outliers) or Dixon's Q-Test must be conducted according to approved SOPs before exclusion.
What is the difference between repeatability and intermediate precision %RSD?
Repeatability %RSD measures precision under identical operating conditions over a short interval (same analyst, same instrument, same day). Intermediate precision %RSD measures within-laboratory variations across different days, different analysts, and different instruments.
The Bottom Line
Relative Standard Deviation (%RSD) is the definitive scale-independent metric for laboratory repeatability, quality control, and scientific precision. Always enforce Bessel's correction (N - 1 degrees of freedom) on sample replicates to eliminate under-estimation bias, verify your results against regulatory limits like USP <621> (≤2.0%), and use Homecalpro's free RSD Calculator for instant, audit-grade verification.
This article is for informational and educational purposes. Always verify complex calculations with a qualified professional or official documentation.