Buying a home is one of those monumental financial crossroads where the number a mortgage lender approves and the number your household can comfortably afford each month without stress are often two radically different realities. Walk into a bank or credit union with solid credit and steady income, and automated underwriting models may pre-approve you for a $450,000 mortgage. But underwriting guidelines do not know—or care—how much you spend each month on infant daycare, groceries, vehicle upkeep, prescription medication, family vacations, or retirement investments. A borrower approved for the absolute limit of their borrowing capacity can quickly find themselves 'house-rich and cash-poor', lying awake at night worrying about the next plumbing emergency or economic downturn.
Conversely, a home that feels initially out of reach might become remarkably sustainable with a slightly larger down payment, a 15-year versus 30-year amortization schedule, moving across county lines to a district with lower property tax assessments, or choosing a property with modest HOA dues. The core financial question in 2026 is never simply, 'How much money will the bank lend me?' The real question every prospective homeowner must answer is: 'How much house can I afford without compromising my family's financial resilience and quality of life?'
That is precisely what an authentic, client-side home affordability calculator helps you determine. In this comprehensive 2026 editorial guide, we deconstruct the exact mathematics of home affordability. You will discover how to calculate your purchasing power using your gross income, recurring debt commitments, down payment liquidity, mortgage interest rate environments, municipal property taxes, homeowners insurance premiums, and post-closing maintenance reserves. With worked mathematical examples, sensitivity stress tests across interest rate regimes, salary benchmarks from $50,000 to $200,000, and a practical 16-point budgeting worksheet, this guide empowers you to master your numbers before speaking to a loan officer or submitting an offer.
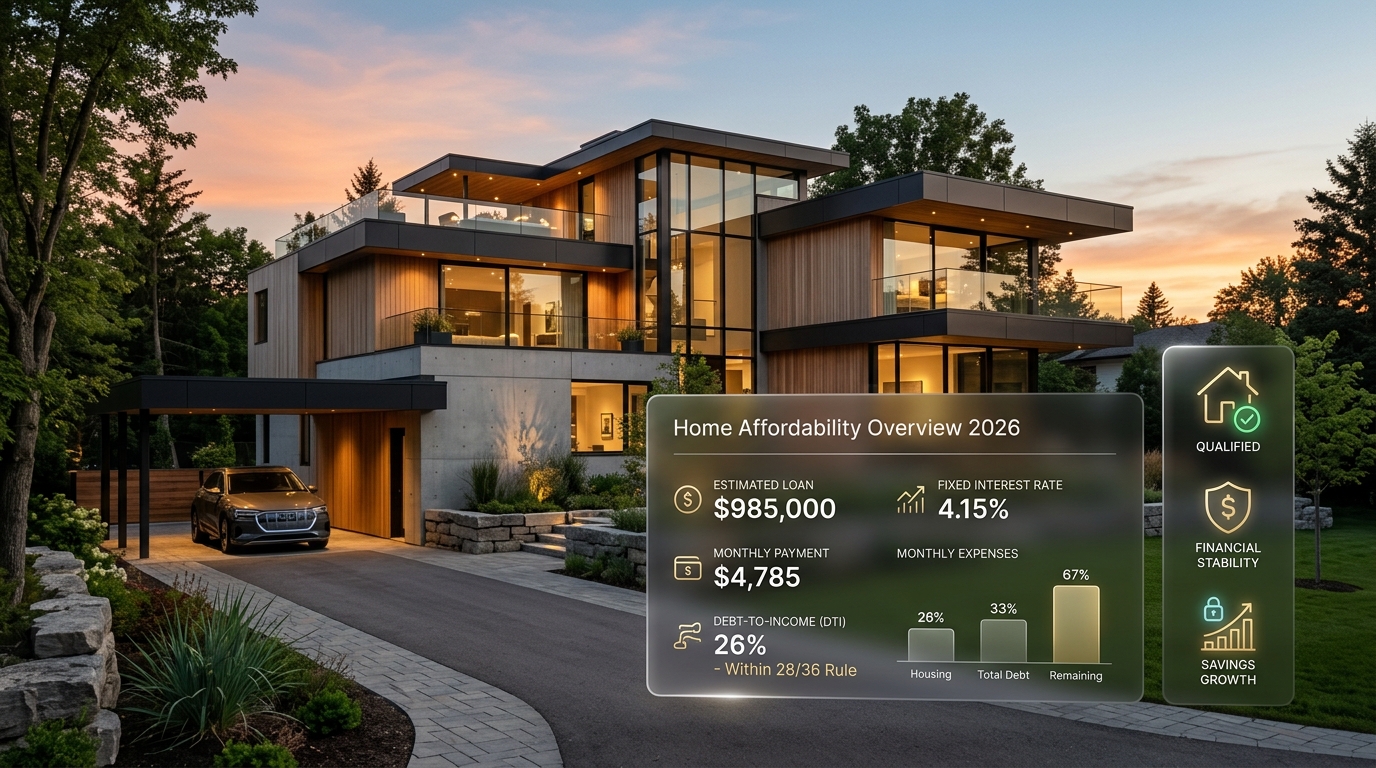
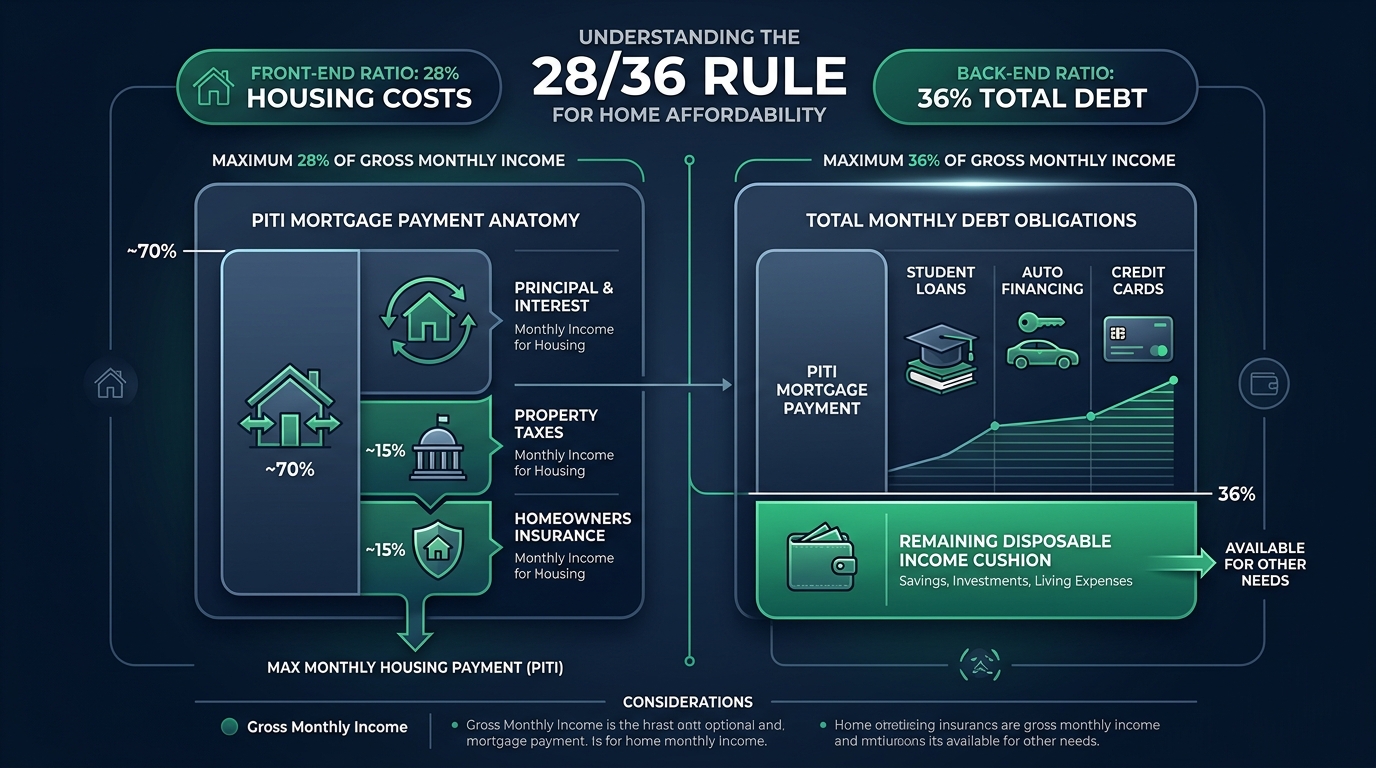
Quick answer:In 2026, estimating how much house you can comfortably afford begins with the traditional 28/36 mortgage rule: your total monthly housing expenses (principal, interest, property taxes, and homeowners insurance, or PITI) should not exceed 28% of your gross monthly income, and your total monthly debt payments (housing plus student loans, auto financing, and credit cards) should not exceed 36%. For a household earning $100,000 annually ($8,333/month), the 28% front-end cap yields a maximum housing budget of $2,333 per month, while the 36% back-end cap allows $3,000 in total monthly debt obligations. However, bank pre-approval reflects what a lender will risk, not what leaves room for groceries, childcare, retirement savings, or emergency repairs. A realistic home purchase price generally falls between 3.0x to 4.2x your gross annual household income, depending on your down payment size, current interest rates, and local municipal property taxes.
1. What Does a Home Affordability Calculator Actually Calculate?
Moving beyond simplistic principal and interest to the true monthly cost of homeownership
A home affordability calculator is an engineering tool designed to reverse-engineer the purchase price or mortgage principal that harmonizes with your personal financial profile. Unlike a standard mortgage payment calculator—which simply takes a predetermined loan balance and computes the contractual repayment—an affordability calculator starts with your income and existing financial obligations and works backward to determine what you can safely borrow.
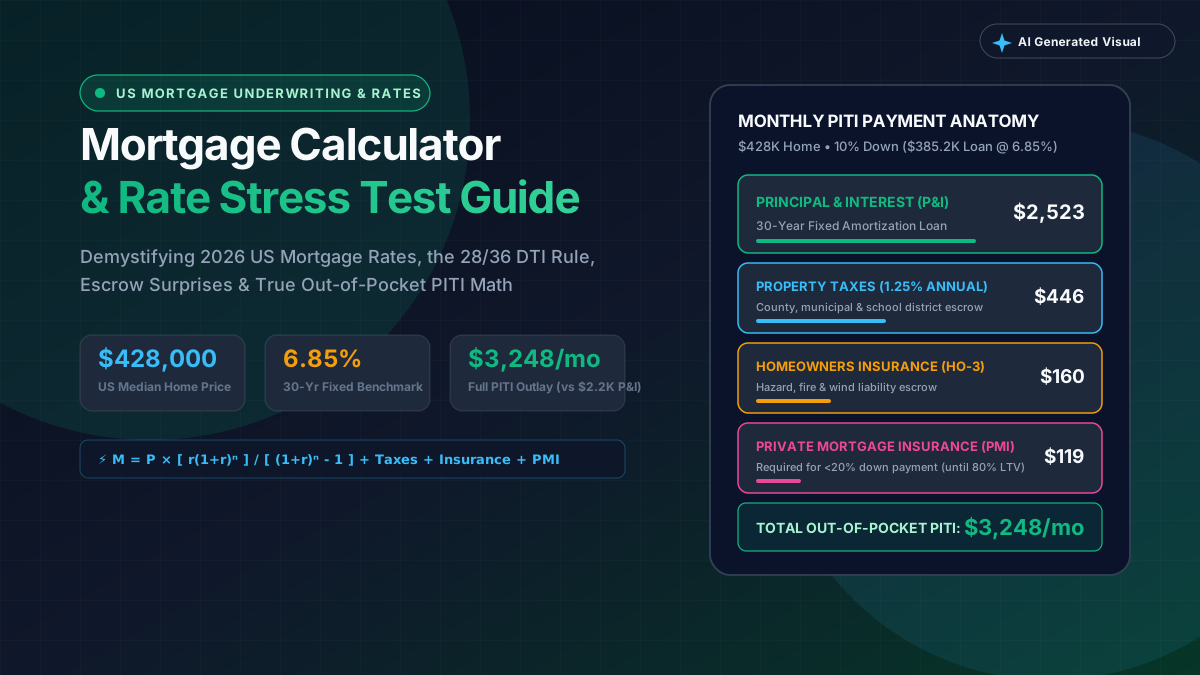
Crucially, a reliable calculator must look far beyond basic monthly principal and interest (P&I). Owning real estate involves a cluster of non-negotiable recurring expenses commonly abbreviated as PITI: Principal, Interest, Taxes, and Insurance. When you also account for mandatory Homeowners Association (HOA) dues and Private Mortgage Insurance (PMI), the actual monthly outflow can be 30% to 50% higher than the raw loan amortization figure alone.
To provide a decision-grade financial estimate, an affordability calculator requires several foundational inputs that each govern a distinct dimension of the home-buying equation:
The Listing Site Pitfall
Many popular real estate search websites display enticingly low estimated payments beneath listings by calculating only principal and interest using an optimistic 20% down payment and pristine credit interest rates. In reality, once local property taxes, hazard insurance, and HOA dues are factored in, the true monthly payment is frequently $500 to $900 higher than the advertised figure.
| Calculator Input | Economic Function | Why It Matters for Affordability |
|---|---|---|
| Annual Gross Household Income | Establishes Baseline Earning Power | Calculates monthly gross cash flow before income taxes, Medicare, and payroll deductions. |
| Monthly Debt Payments | Measures Committed Cash Flow | Captures non-housing debt obligations (car loans, student loans, credit cards) that limit borrowing room. |
| Down Payment Available | Determines Required Borrowing | Reduces total loan principal, lowers monthly interest, and dictates whether costly PMI is required. |
| Mortgage Interest Rate | Sets the Cost of Borrowed Capital | Even a 0.5% rate fluctuation dramatically swings the monthly principal and interest payment. |
| Loan Term (Years) | Defines Repayment Velocity | A 30-year term provides lower monthly payments; a 15-year term builds equity twice as fast at higher monthly cost. |
| Estimated Property Taxes | Mandatory Local Municipal Surcharge | Varies drastically by county and state, directly inflating the monthly escrow obligation. |
| Homeowners Hazard Insurance | Protects Physical Asset Collateral | Protects against fire, wind, and storm damage; premiums vary by region, age, and natural disaster risk. |
| HOA / Condo Association Fees | Mandatory Community Maintenance | Directly reduces allowable mortgage payment dollar-for-dollar under bank underwriting rules. |
| Post-Closing Cash Reserves | Household Safety Buffer | Ensures you do not spend every liquid dollar on the transaction, preserving emergency liquidity. |
2. The 28/36 Rule: A Useful Starting Point, Not a Final Answer
Understanding front-end housing ratios vs. back-end total debt capacity
The 28/36 rule has served as the foundational benchmark of conventional mortgage underwriting for decades. While modern computerized underwriting systems (such as Fannie Mae's Desktop Underwriter) can grant approvals at higher ratios for borrowers with compensating factors, the 28/36 ratio remains the gold standard for sustainable consumer budgeting.
The rule is composed of two distinct mathematical tests: the Front-End Ratio (the housing guideline) and the Back-End Ratio (the total debt guideline). To evaluate your eligibility and safety, lenders compute both ratios and enforce the tighter of the two limits.
Under the 28% front-end guideline, your total proposed housing expenses (PITI + HOA + PMI) should not consume more than 28% of your gross monthly income. Under the 36% back-end guideline, your total monthly debt payments—including the proposed housing payment PLUS all recurring consumer debts such as auto loans, student loans, and credit card minimum payments—must not exceed 36% of gross monthly income.
Let us examine how this works for a household earning $7,500 per month before taxes ($90,000 annually) with $700 in existing monthly debt ($450 auto loan + $250 student loans):
 AI Generated Image
Debt-to-Income (DTI) Ratios
Front-End DTI (%) = (Total Monthly Housing Expenses ÷ Gross Monthly Income) × 100 Back-End DTI (%) = (Total Monthly Housing Expenses + All Recurring Monthly Debts ÷ Gross Monthly Income) × 100
| Benchmark Metric | Mathematical Formula | Household Calculation | Resulting Monthly Limit |
|---|---|---|---|
| Gross Monthly Income | $90,000 ÷ 12 | $7,500 / month | Baseline Earning Capacity |
| 28% Front-End Housing Ceiling | $7,500 × 0.28 | $2,100 / month | Maximum Proposed Housing Cost |
| 36% Back-End Total Debt Ceiling | $7,500 × 0.36 | $2,700 / month | Maximum Total Debt Outflow |
| Existing Monthly Debt Obligations | Auto ($450) + Student ($250) | $700 / month | Committed Non-Housing Payments |
| Remaining Housing Capacity (Back-End) | $2,700 − $700 | $2,000 / month | Tighter Back-End Constraint |
| Binding Affordability Ceiling | min($2,100, $2,000) | $2,000 / month | Preliminary Safe Housing Budget |
3. How to Calculate How Much House You Can Afford: Step-by-Step
Reverse-engineering your maximum home price from a sustainable monthly budget
The fatal mistake most prospective homebuyers make is browsing real estate listings first, falling in love with a property, and then attempting to stretch their budget to fit the purchase price. The prudent mathematical approach is to work backward from a proven monthly payment ceiling.
Follow this rigorous five-step formula to establish your true home-buying budget:
Step 1: Calculate Your Reliable Gross Monthly Income. Sum all dependable, verifiable household income (W-2 salaries, steady contracted earnings) and divide by 12. If you receive irregular bonuses, commission splits, or freelance payments, use a conservative two-year average rather than assuming peak months will persist indefinitely.
Step 2: Tabulate Your Existing Monthly Debt Obligations. Review your credit bureau files and bank statements to identify all contractual monthly payments: car notes, minimum credit card amounts, student loan payments, and personal loans. Calculate your back-end capacity (Gross Income × 0.36 − Debts) and compare it against your front-end limit (Gross Income × 0.28). Select the lower figure as your baseline housing cap.
Step 3: Estimate Recurring Taxes, Insurance, and HOA Costs. Subtract anticipated monthly non-mortgage escrow costs from your housing cap. Typical planning estimates allocate $300–$450 for property taxes, $120–$180 for hazard insurance, and $50–$150 for HOA dues depending on the property type. What remains is your net Principal and Interest (P&I) budget.
Step 4: Convert Your Monthly P&I Budget into a Mortgage Principal. Using the standard fully amortizing fixed-rate mortgage formula, determine the maximum loan balance your monthly payment supports at prevailing interest rates:
Step 5: Add Your Down Payment to Determine Total Purchase Price. Finally, add your available down payment to the calculated loan principal. However, you must first deduct anticipated closing costs (2% to 5% of purchase price) and a 3-to-6 month emergency cash reserve from your total liquid savings.
Loan Principal Conversion Formula
P = M × [ (1 + r)^n − 1 ] ÷ [ r × (1 + r)^n ] Where P = Loan Principal, M = Monthly Principal & Interest Budget, r = Monthly Interest Rate (Annual Rate ÷ 12), and n = Total Payments (360 for a 30-year loan, 180 for a 15-year loan).
4. Worked Example: Can a Household Earning $100,000 Afford a $350,000 Home?
A transparent mathematical audit of a real-world home purchase scenario
Now let us test this monthly payment against the buyer's gross income. At $100,000 per year, gross monthly income is $8,333. Dividing $2,370 by $8,333 yields a front-end housing ratio of 28.44%.
This sits virtually on top of the traditional 28% front-end guideline. If this household has less than $630 in other monthly debt payments ($3,000 back-end cap − $2,370 housing = $630), this $350,000 purchase is fully approvable by mortgage underwriters.
However, consider the take-home reality: after federal income taxes, state taxes, FICA (Social Security & Medicare), and employer healthcare deductions, a $100,000 salary typically nets between $5,800 and $6,300 in take-home pay. A $2,370 housing payment consumes 38% to 41% of actual spendable cash flow. If the household has two young children in daycare ($1,600/month) or high student loan debts, this 'approved' mortgage will feel extremely tight.
The Take-Home Pay Reality Check
Always calculate your proposed housing cost as a percentage of your net take-home pay, not just gross salary. If your total housing payment exceeds 35% of your direct paycheck deposits, you will have limited flexibility to handle vehicle breakdowns, medical expenses, or routine home repairs.
| Expense Component | Monthly Outflow | Annual Outflow | Share of Monthly Payment |
|---|---|---|---|
| Mortgage Principal & Interest | $1,770 | $21,240 | 74.7% |
| Local Property Taxes | $350 | $4,200 | 14.8% |
| Homeowners Hazard Insurance | $150 | $1,800 | 6.3% |
| Homeowners Association (HOA) Dues | $100 | $1,200 | 4.2% |
| Private Mortgage Insurance (PMI) | $0 | $0 | 0.0% (20% Down Paid) |
| Total Estimated Monthly Housing Outflow | $2,370 | $28,440 | 100.0% |
5. Why Mortgage Interest Rates Can Change Your Budget Dramatically
The compounding impact of rate fluctuations on borrowing capacity and total interest paid
The difference between borrowing $300,000 at 5.50% versus 7.50% is a staggering $395 per month—or $4,740 every single year. Over the full 30-year amortization schedule, that two-percentage-point difference forces the borrower to pay an extra $141,944 purely in bank interest.
Even more crucially, if your household has a fixed monthly principal and interest budget of $1,896, a rise in prevailing interest rates from 5.50% to 7.50% slashes your maximum allowable borrowing amount from roughly $334,000 down to $271,000—erasing over $63,000 of home-buying power without your income changing by a single penny.
This is why prudent homebuyers always stress-test their budgets using interest rates 0.75% to 1.00% higher than current advertised quotes. If your budget breaks under a minor rate fluctuation during your home search, your target purchase price is too aggressive.
The 'Marry the House, Date the Rate' Myth
Real estate agents frequently advise buyers to 'date the rate and marry the house', implying that you can simply refinance when interest rates drop. Never purchase a property whose monthly payment is unsustainable today based on the speculative gamble of future central bank rate cuts. If macroeconomic inflation stays sticky or property values dip, refinancing may be impossible.
| Interest Rate (APR) | Monthly Principal & Interest | Annual Debt Service | Total Lifetime Interest Paid | Delta vs. 5.50% Baseline |
|---|---|---|---|---|
| 5.50% Fixed | $1,703 / month | $20,436 / year | $313,222 | Baseline ($0) |
| 6.00% Fixed | $1,799 / month | $21,588 / year | $347,515 | +$96/mo (+$34,293 total) |
| 6.50% Fixed | $1,896 / month | $22,752 / year | $382,633 | +$193/mo (+$69,411 total) |
| 7.00% Fixed | $1,996 / month | $23,952 / year | $418,527 | +$293/mo (+$105,305 total) |
| 7.50% Fixed | $2,098 / month | $25,176 / year | $455,166 | +$395/mo (+$141,944 total) |
6. The Down Payment Question: Is 20% Always Necessary?
Debunking the 20% down myth and comparing low-down-payment loan alternatives
As the table demonstrates, putting 5% down requires $52,500 less cash at the closing table than putting 20% down. However, the 5% buyer faces a monthly payment that is $472 to $542 higher every month due to higher debt service and Private Mortgage Insurance.
The optimal strategy depends on your overall balance sheet. Emptying your entire emergency savings account simply to hit an arbitrary 20% threshold leaves you dangerously exposed to unexpected job losses or catastrophic repair bills right after move-in. In many cases, putting 10% down and retaining $20,000 in liquid reserves is vastly safer than putting 20% down with zero cash left in the bank.
Liquidity Over Pride
Private Mortgage Insurance (PMI) is not wasted money if it preserves a healthy emergency fund. On conventional loans, PMI automatically terminates once your loan-to-value ratio reaches 78% of the original purchase price. Never compromise your family's financial safety buffer just to avoid a temporary PMI charge.
| Down Payment % | Upfront Cash Down | Mortgage Balance | Est. Monthly P&I (6.5%) | Monthly PMI | Total Monthly P&I + PMI |
|---|---|---|---|---|---|
| 5% Down | $17,500 | $332,500 | $2,102 | $140–$210 | $2,242–$2,312 |
| 10% Down | $35,000 | $315,000 | $1,991 | $80–$130 | $2,071–$2,121 |
| 15% Down | $52,500 | $297,500 | $1,880 | $40–$75 | $1,920–$1,955 |
| 20% Down | $70,000 | $280,000 | $1,770 | $0 (No PMI) | $1,770 |
7. Closing Costs: The Expense Many Buyers Underestimate
Understanding the mandatory friction costs of transferring real estate ownership
Failing to account for closing costs can derail a transaction just days before settlement. When shopping for properties, request a detailed Loan Estimate from prospective mortgage lenders and ensure your liquid assets cover both your intended down payment and your closing costs without touching your emergency fund.
| Closing Cost Percentage | Estimated Closing Cash | Down Payment (10%) | Total Liquid Cash Required at Closing |
|---|---|---|---|
| 2.0% (Low-Fee / Low-Tax County) | $7,000 | $35,000 | $42,000 |
| 3.0% (Average US National Benchmark) | $10,500 | $35,000 | $45,500 |
| 4.0% (Moderate Transfer Tax Area) | $14,000 | $35,000 | $49,000 |
| 5.0% (High-Tax Urban Metro / High Escrow) | $17,500 | $35,000 | $52,500 |
8. The Costs After Closing: Maintenance, Utilities, and Repairs
The hidden expenses of homeownership that never appear on a mortgage statement
Homes older than 30 years often require 1.5% to 2.0% annually due to aging plumbing, electrical wiring, and exterior siding. Factoring this $200–$400 monthly repair sinking fund into your initial affordability calculation ensures you can preserve your property's value without resorting to high-interest credit cards.
The Automated Sinking Fund Strategy
Set up an automatic recurring bank transfer of $250 to $300 into a separate high-yield savings account labeled 'Home Repairs' on the day your paycheck deposits. When an appliance inevitably breaks, you can write a check from cash reserves without disrupting your monthly living budget.
| Home Purchase Price | Annual 1% Maintenance Allocation | Monthly Sinking Fund Transfer | 5-Year Capital Reserve Target |
|---|---|---|---|
| $250,000 Home | $2,500 / year | $208 / month | $12,500 |
| $350,000 Home | $3,500 / year | $292 / month | $17,500 |
| $450,000 Home | $4,500 / year | $375 / month | $22,500 |
| $600,000 Home | $6,000 / year | $500 / month | $30,000 |
9. Property Taxes and Homeowners Insurance Can Completely Change the Equation
Why two homes with identical $350,000 price tags can have drastically different monthly burdens
Over a single year, Home B costs $5,700 more than Home A to live in, despite having the exact same sticker price. Over ten years, that is $57,000 in additional non-recoverable escrow outflow.
Always research property-specific tax records on the county assessor's website before making an offer. Be especially vigilant about post-sale tax reassessments: in many jurisdictions, if a property was owned by the seller for decades under a homestead exemption cap, the county will reassess the property at your higher purchase price the following year, causing an unexpected spike in your monthly escrow payment.
| Payment Component | Home A (Low-Tax / Low-Risk Region) | Home B (High-Tax / Coastal-Risk Region) | Monthly Cost Difference |
|---|---|---|---|
| Purchase Price & Loan | $350,000 ($280,000 loan) | $350,000 ($280,000 loan) | $0 (Identical Financing) |
| Principal & Interest (6.5%) | $1,770 / month | $1,770 / month | $0 |
| Monthly Property Taxes | $250 / month (0.85% rate) | $550 / month (1.88% rate) | +$300 / month |
| Monthly Homeowners Insurance | $125 / month | $300 / month (Wind/Hail Surcharge) | +$175 / month |
| Total Monthly PITI Payment | $2,145 / month | $2,620 / month | +$475 / month (+$5,700/year!) |
10. Your Credit Score and Debt-to-Income (DTI) Ratio
How underwriting algorithms grade your financial stability and loan pricing
Your household income determines how much money flows into your bank accounts, but your credit score and Debt-to-Income (DTI) ratio determine the interest rate you are offered and the maximum loan amount an underwriter will approve.
Lenders use risk-based pricing matrices established by Fannie Mae and Freddie Mac (known as Loan-Level Price Adjustments, or LLPAs). A borrower with an excellent 760 FICO score will secure the most competitive interest rates and lowest private mortgage insurance premiums. A borrower with a 640 credit score might face an interest rate 0.75% to 1.25% higher, significantly depressing their maximum affordable loan balance.
Meanwhile, your Debt-to-Income (DTI) ratio compares your mandatory monthly debt payments with your gross monthly income:
DTI (%) = (Total Qualifying Monthly Debt Payments ÷ Gross Monthly Income) × 100
For example, if your proposed mortgage payment (PITI + HOA) is $2,400, your auto and student loans total $800, and your gross household income is $8,000 per month, your back-end DTI is ($3,200 ÷ $8,000) × 100 = 40.0%.
While standard conventional guidelines aim for a 36% back-end DTI, automated underwriting software can approve DTIs up to 43% to 45% (and occasionally 50% for FHA loans) when strong compensating factors exist—such as significant cash reserves or large down payments. However, qualifying for a 45% DTI does not mean you should take it. Allocating 45% of your gross income to debt service leaves virtually no cushion for ordinary living expenses.
11. How Much House Can You Afford on Different Salaries? ($50k to $200k)
Salary-by-salary housing budget allocation benchmarks based on the 28% rule
Remember that these dollar ranges are illustrative planning benchmarks. Your actual purchase ceiling will vary depending on your specific down payment, credit tier, regional tax assessments, and existing debt profile.
| Annual Gross Household Income | Gross Monthly Income | 28% Monthly Housing Budget | Est. Affordable Purchase Price Range | Key Financial Considerations |
|---|---|---|---|---|
| $50,000 / year | $4,167 / month | $1,167 / month | $160,000 – $190,000 | Requires low-cost housing markets or USDA/FHA assistance; minimal consumer debt capacity. |
| $60,000 / year | $5,000 / month | $1,400 / month | $195,000 – $230,000 | Starter condo or suburban townhome; property tax rates significantly impact allowable loan size. |
| $75,000 / year | $6,250 / month | $1,750 / month | $245,000 – $290,000 | Moderate price tier; requires careful management of student loans and car financing. |
| $80,000 / year | $6,667 / month | $1,867 / month | $265,000 – $315,000 | Comfortable starter home budget in many mid-tier American metros; sensitive to HOA dues. |
| $100,000 / year | $8,333 / month | $2,333 / month | $330,000 – $390,000 | National median purchasing tier; supports $350k home comfortably if debt is under $600/month. |
| $120,000 / year | $10,000 / month | $2,800 / month | $400,000 – $470,000 | Strong purchasing capacity; enables 20% down payment savings within 2–3 years of disciplined budgeting. |
| $150,000 / year | $12,500 / month | $3,500 / month | $510,000 – $600,000 | Upper-middle suburban single-family home tier; ample room for 401(k) and college savings. |
| $200,000 / year | $16,667 / month | $4,667 / month | $680,000 – $800,000 | High purchasing power; jumbo mortgage thresholds may apply in competitive coastal markets. |
12. Can You Afford a House on a Single Income?
Navigating the unique risks and defensive budgeting required when one earner carries the mortgage
Buying a home on a single income is completely achievable, but it demands an elevated standard of risk management. When a dual-income household experiences a job layoff, the surviving income can often cover mortgage obligations and groceries while the second partner seeks employment. In a single-income household, an employment disruption eliminates 100% of the household cash flow overnight.
Before committing to a mortgage as a solo earner, evaluate these five critical safety gates:
1. Do you hold a 6-to-9 month liquid emergency reserve? While dual-income buyers can often manage with 3 to 4 months of expenses in reserve, single-income buyers should maintain a minimum of 6 to 9 months of full living costs in an FDIC-insured high-yield savings account.
2. How resilient is your career field? If you work in a cyclical or volatile industry, borrowing at the absolute top of your qualification range introduces unacceptable vulnerability.
3. Are you relying on overtime or variable bonuses to qualify? Base your budget strictly on your guaranteed base salary. If your mortgage only works when you work overtime shifts, the payment is too dangerous.
4. Can your cash flow withstand an unexpected $3,000 repair bill? If a failed HVAC compressor or transmission repair forces you onto high-interest credit cards, your housing budget is too tight.
5. Are you sacrificing retirement contributions? You can borrow money for a house, but you cannot borrow money for retirement. Ensure your housing payment allows you to continue contributing at least 15% of your gross pay toward retirement funds.
For a single-income buyer, the safest purchase strategy is to target a housing payment capped at 22% to 25% of gross income rather than stretching to the full 28% limit.
13. How Much House Can You Afford with Student Loans or a Car Payment?
The direct trade-off between consumer debt service and real estate purchasing power
In Scenario D, carrying $1,200 in monthly consumer debt obliterates nearly $90,000 in mortgage borrowing capacity. That is the difference between purchasing a spacious single-family home in a top school district versus settling for a cramped fixer-upper.
Should you pay off debt before buying? If you have high-interest revolving credit card debt (18% to 28% APR), pay it off immediately before applying for a mortgage. If you have low-interest federal student loans (3% to 5% fixed), keeping your cash for down payment and emergency reserves is often financially superior.
| Debt Scenario | Monthly Consumer Debt | Remaining Allowable Housing Budget | Supported Loan Principal (6.5% APR) | Purchasing Power Lost |
|---|---|---|---|---|
| Scenario A: Zero Consumer Debt | $0 / month | $2,240 / mo (capped by 28% front-end) | $354,000 Loan | Full Borrowing Power ($0 Lost) |
| Scenario B: Student Loans Only | $300 / month | $2,240 / mo (front-end remains binding) | $354,000 Loan | $0 Lost (Back-end $2,580 > $2,240) |
| Scenario C: Student Loan + 1 Car Note | $750 / month | $2,130 / mo (back-end becomes binding) | $337,000 Loan | −$17,000 Loan Capacity |
| Scenario D: Student Loans + 2 Car Notes | $1,200 / month | $1,680 / mo (severe back-end constraint) | $265,000 Loan | −$89,000 Loan Capacity! |
14. Should You Buy Now or Wait Until You Have Saved More?
Weighing mortgage market timing against personal financial stability and the 5-year tenure rule
Prospective buyers constantly ask whether they should buy immediately or wait on the sidelines in hopes of lower mortgage rates or softer home prices. The historical reality of real estate markets is that trying to time interest rates and home valuations is virtually impossible.
The decision to buy versus wait should be governed by your personal financial stability and three pragmatic criteria:
1. The 5-Year Residency Rule: Real estate transactions carry substantial friction costs (2%–5% buyer closing costs when purchasing; 5%–7% agent commissions and transfer taxes when selling). If you anticipate relocating, changing careers, or expanding your family within the next 3 to 5 years, renting provides superior financial flexibility and lower transaction loss risk.
2. Debt and Cash Flow Health: If you carry high-interest consumer debt or lack a 3-month emergency fund, waiting 12 to 18 months to eliminate bad debt and accumulate liquidity is vastly more beneficial than rushing into homeownership.
3. Monthly Cost Parity: Compare the true all-in cost of owning (PITI + maintenance sinking fund + utilities) against local rental costs for an equivalent property. In certain overheated metros, renting while aggressively investing your surplus cash in diversified index funds builds net worth faster than buying an overvalued property.
15. A Practical Home Affordability Worksheet
Your step-by-step audit to calculate your personal comfort ceiling before browsing listings
Before submitting a purchase offer, run the three critical checks: Does the payment fit comfortably under Line 10? Does the payment take less than 35% of your net take-home pay? And does Line 16 remain untouched in your savings account on closing day? If all three answers are yes, your purchase is financially sound.
| Financial Item | Calculation / Source | Your Household Amount |
|---|---|---|
| 1. Annual Gross Household Income | Sum of reliable W-2 salaries & steady income | $________________ / year |
| 2. Gross Monthly Income | Line 1 divided by 12 | $________________ / month |
| 3. 28% Front-End Housing Cap | Line 2 multiplied by 0.28 | $________________ / month |
| 4. 36% Back-End Total Debt Cap | Line 2 multiplied by 0.36 | $________________ / month |
| 5. Monthly Auto Loan Payments | Sum of all vehicle financing notes | $________________ / month |
| 6. Monthly Student Loan Payments | Contractual monthly student loan bill | $________________ / month |
| 7. Monthly Credit Card Minimums | Sum of all active credit card statements | $________________ / month |
| 8. Total Monthly Consumer Debt | Sum of Lines 5, 6, and 7 | $________________ / month |
| 9. Remaining Back-End Housing Cap | Line 4 minus Line 8 | $________________ / month |
| 10. Binding Maximum Housing Cap | Lower of Line 3 or Line 9 | $________________ / month |
| 11. Est. Monthly Taxes, Insurance & HOA | Subtract property tax, hazard insurance, HOA | − $_______________ / month |
| 12. Net Monthly Principal & Interest Budget | Line 10 minus Line 11 | $________________ / month |
| 13. Maximum Supported Loan Principal | Amortization formula at prevailing interest rate | $________________ loan |
| 14. Available Liquid Cash for Down Payment | Total liquid savings minus reserves and closing costs | $________________ cash down |
| 15. Target Maximum Home Purchase Price | Line 13 plus Line 14 | $________________ home price |
| 16. Post-Closing Emergency Cash Reserve | Minimum 3 to 6 months living expenses retained | $________________ emergency fund |
16. 7 Common Home Affordability Calculator Mistakes to Avoid
How incomplete inputs lead to severe post-closing financial strain
Even the most sophisticated financial calculator will output dangerously flawed advice if fed inaccurate assumptions. Avoid these seven classic home affordability traps:
Mistake 1: Ignoring Property Taxes and Hazard Insurance. Calculating affordability based solely on loan principal and interest ignores up to 35% of your true monthly obligation.
Mistake 2: Confusing Gross Income with Take-Home Pay. Lenders qualify you on gross income, but you live on net take-home pay. Always verify that your proposed housing payment fits inside your actual paycheck deposits.
Mistake 3: Relying on Promotional Teaser Interest Rates. Advertised rates often require paying 1 to 2 discount points upfront ($3,500 to $7,000 in cash) or apply only to 15-year loans with 780+ FICO scores. Use realistic, unpointed rate quotes for your actual credit tier.
Mistake 4: Exhausting Every Dollar of Savings for the Down Payment. Committing 100% of your liquidity to closing leaves you defenseless against immediate repair bills, moving costs, and unexpected emergencies.
Mistake 5: Treating the Bank's Pre-Approval Limit as a Target. Mortgage pre-approval represents the maximum risk a bank will tolerate before rejecting your loan. It is a ceiling, never a recommendation. Prudent buyers typically purchase at 75% to 85% of their pre-approval ceiling.
Mistake 6: Forgetting that Taxes, Insurance, and HOA Dues Escalate. Unlike fixed mortgage principal and interest, property taxes and insurance premiums rise over time with inflation and reassessments. Leave room in your budget for future increases.
Mistake 7: Comparing Properties Solely by Purchase Price. A $330,000 home with $500/month property taxes and $200/month HOA dues costs significantly more each month than a $360,000 home with $180/month taxes and zero HOA fees.
17. How to Use a Home Affordability Calculator Effectively for Scenario Planning
Stress-testing your financial resilience across conservative, expected, and stretch models
The most effective way to utilize a home affordability calculator is as a multi-scenario sensitivity engine rather than a tool that produces one rigid number. Before meeting with real estate agents, build three distinct financial scenarios:
• The Conservative Scenario: Input an interest rate 0.50% higher than current quotes, assume lower down payment liquidity, and estimate upper-bound property taxes and insurance. This reveals your bulletproof baseline price—the home you can afford even in a tough economy.
• The Expected Scenario: Use realistic current market quotes, your intended down payment, and average regional property tax assessments. This establishes your primary search target.
• The Stretch Scenario: Explore a higher purchase price or lower down payment option to understand the exact trade-offs. Notice how much higher your monthly payment climbs and determine whether the additional square footage justifies the reduced cash flow.
By comparing these three scenarios side-by-side on HomeCalPro's calculators, you can clearly identify your personal boundaries and make confident, unemotional decisions in competitive bidding environments.
18. What a Home Affordability Calculator Cannot Tell You
The qualitative life factors and physical property realities beyond algorithmic formulas
A digital affordability calculator is a powerful mathematical instrument, but it cannot replace human judgment, licensed professional inspections, or local real estate expertise.
An algorithm cannot evaluate:
• Your Career and Income Trajectory: Whether your industry faces downsizing risks or whether substantial salary promotions are imminent.
• Future Family Expansion: Planned children, aging parents moving into the home, or college tuition funding needs.
• Physical Property Condition: Undetected foundation settling, aged plumbing, or deteriorating electrical panels revealed during a licensed home inspection.
• Special HOA Assessments: Unfunded capital reserves in a condominium complex that could trigger surprise $10,000 special assessments.
Use HomeCalPro's calculators as your quantitative starting compass. Combine those calculations with a thorough home inspection, a verified Loan Estimate from an experienced mortgage professional, and an honest review of your personal household priorities before making the biggest purchase of your life.
Frequently Asked Questions
Click any question below to expand quick answers, formulas, and expert tips.
How much house can I afford on a $60,000 salary?
On a $60,000 gross annual salary ($5,000 gross monthly income), the traditional 28% front-end guideline caps your total monthly housing payment at approximately $1,400 per month. Assuming a 30-year fixed mortgage at 6.50% APR with 10% down, typical property taxes ($200/mo), hazard insurance ($100/mo), and modest PMI, this budget supports a home purchase price between roughly $195,000 and $230,000, provided your existing monthly consumer debts are under $400/month.
How much house can I afford on a $100,000 salary?
A $100,000 gross salary equals approximately $8,333 in gross monthly income. Under the 28% housing guideline, your target monthly housing payment is approximately $2,333 per month. At a 6.50% fixed interest rate with a 20% down payment ($70,000) and average property taxes and insurance, you can comfortably afford a home priced between $330,000 and $390,000. If you put down less (e.g. 5% to 10%) or carry high car payments and student loans, your safe purchase range adjusts to $290,000 to $340,000.
Is the 28/36 rule still useful in 2026?
Yes. While automated mortgage underwriting engines (like Fannie Mae DU) can approve loans with back-end DTIs up to 45% or 50% for well-qualified borrowers, the 28/36 rule remains the single most reliable guideline for long-term personal financial peace of mind. Borrowers who exceed 36% back-end DTI frequently struggle to fund retirement accounts, emergency savings, and family living expenses.
Does a home affordability calculator include property taxes and insurance?
Comprehensive calculators (like HomeCalPro's Mortgage & Affordability Calculator) allow you to customize both property taxes and homeowners insurance. Basic calculators on listing sites often display only principal and interest, misleading buyers by omitting $300 to $800 in monthly escrow obligations. Always verify that all four PITI components are included.
How much should I save in total cash before buying a home?
Prudent financial planning requires saving for three separate buckets before purchasing: (1) your chosen down payment (3% to 20% of purchase price), (2) closing costs and escrow impounds (2% to 5% of purchase price), and (3) a post-closing emergency cash reserve equal to 3 to 6 months of full living expenses. Never deplete your entire liquid savings account to close on a home.
Can I afford to buy a house if I have student loans?
Yes, millions of homeowners carry student debt. Lenders factor your contractual monthly student loan payment (or 0.5% to 1.0% of the outstanding balance for loans on income-driven repayment plans) into your 36% back-end debt-to-income ratio. If your income is sufficient to accommodate both your student loan payment and the proposed mortgage payment within 36% to 43% DTI, you can easily qualify.
Should I use my savings for a larger down payment or keep a cash buffer?
Maintaining a liquid cash buffer is almost always more important than stretching to make a slightly larger down payment. While putting 20% down eliminates Private Mortgage Insurance, having zero cash left over leaves you vulnerable to emergency repairs or unexpected income loss. In many situations, putting 10% down and retaining $20,000 in a high-yield emergency fund is much safer than putting 20% down with zero cash remaining.
Is a 30-year mortgage better than a 15-year mortgage?
A 30-year fixed mortgage offers lower required monthly payments, maximizing your household cash flow flexibility. A 15-year fixed mortgage features lower interest rates (typically 0.5% to 0.75% lower) and saves tens of thousands of dollars in lifetime interest, but requires roughly 35% higher monthly payments. Most financial advisors recommend choosing a 30-year loan for safety and prepaying extra principal when your cash flow allows.
What is the difference between a mortgage calculator and a home affordability calculator?
A mortgage calculator starts with a known home price and loan balance and calculates the resulting monthly payment and amortization schedule. A home affordability calculator works in reverse: it starts with your income, monthly debt payments, down payment cash, and local tax rates, and reverse-engineers the maximum sustainable purchase price you can afford.
How accurate is an online home affordability calculator?
The mathematical calculations are exact based on standard amortization and debt-to-income formulas. However, the accuracy of the result depends entirely on the accuracy of your inputs—specifically local property tax millage rates, homeowners hazard insurance quotes, HOA dues, and loan origination fees. Treat online calculations as your strategic planning roadmap, and obtain formal Loan Estimates from lenders when shopping.
The Bottom Line
The most useful answer to 'How much house can I afford?' is never the absolute maximum dollar figure a lender's automated underwriting engine approves. It is the sustainable monthly payment that allows your family to cover mortgage principal, interest, taxes, and insurance while comfortably funding retirement accounts, emergency savings, and ordinary life. Start with your real net income, subtract your debt, protect your post-closing cash reserves, and run your real-world scenarios through HomeCalPro's free client-side financial calculators before stepping into the 2026 housing market.
This article is for informational and educational purposes. Always verify complex calculations with a qualified professional or official documentation.
Authoritative References & Government Sources
Verify mortgage underwriting guidelines, rate statistics, and tax rules from official regulatory agencies.
- Consumer Financial Protection Bureau (CFPB) — Buying a House Guide
Official federal consumer guidance on mortgage shopping, standard Loan Estimates, closing disclosure audits, and closing costs.
- Consumer Financial Protection Bureau (CFPB) — Explore Interest Rates
Interactive federal database tracking current mortgage rate distributions across US states based on credit score tiers and loan products.
- Fannie Mae — Homeownership Preparation & Underwriting Education
Conforming loan underwriting guidelines, standard debt-to-income benchmarks, and homebuyer readiness resources.
- Freddie Mac — Primary Mortgage Market Survey (PMMS)
Weekly historical benchmarks for 30-year fixed, 15-year fixed, and adjustable-rate mortgages across the United States.
- Internal Revenue Service (IRS) — Real Estate Tax Tips & Topic 503
Federal guidance on deductible mortgage interest, local property tax deduction limits, and capital gains exemptions on home sales.