Walk into any grocery store in suburban Ohio, Texas, or Arizona on a Saturday morning, and the quiet financial friction of modern American life hits you before you even reach the register. A standard weekly cart of eggs, ground beef, paper towels, and dairy that comfortably cost $115 four years ago now rings up at $187. You return home, open your banking application, and glance at your credit card statement: your variable annual percentage rate (APR) has crept from 15.4% up to a punitive 24.2%. Down the street, a young family shopping for their first home discovers that the monthly payment on a modest $380,000 house has surged by more than $950 per month compared to 2021—not because the house changed, but because benchmark mortgage interest rates were aggressively pushed upward.
That evening, a headline flashes across the financial news: 'Bureau of Labor Statistics Releases Latest US PPI Report: Final Demand Inflation Rises Faster Than Expected; Markets Price in 75% Probability of Another Federal Reserve Rate Hike.' To millions of hardworking Americans, terms like the 'PPI report', 'core wholesale inflation', 'intermediate demand pipelines', and 'federal funds target ranges' sound like sterile Wall Street jargon meant exclusively for bond traders and central bankers in Washington, D.C. But in reality, the Producer Price Index is the earliest, most reliable economic radar detection system that exists for your personal checking account.
By the time inflation shows up as a price increase on the shelf at Target or the pump at your local gas station, the economic war has already been lost. The price hike was negotiated in wholesale contracts, freight logistics corridors, and chemical processing facilities two to three months earlier. This comprehensive guide strips away academic abstractions to give American consumers the raw mathematical truth. We examine how the US PPI report works, trace the step-by-step pipeline from factory gate to retail receipt, expose the hidden pain points of Federal Reserve rate hikes across housing and consumer credit, and show you exactly how to use Homecalpro's free client-side financial calculators to protect your family's purchasing power and long-term wealth.
Quick answer:The Producer Price Index (PPI) tracks the average change over time in the selling prices received by domestic producers for their output. In the United States, it functions as the economy's primary leading indicator of consumer inflation. When the monthly PPI report reveals surging input costs for raw manufacturing, agricultural feed, packaging, and freight transportation, corporations systematically pass those expenses down the distribution chain to preserve profit margins. Approximately 60 to 90 days later, this wholesale surge manifests on retail shelves as elevated Consumer Price Index (CPI) numbers. In response to persistent inflation running above its statutory 2.0% annual target, the Federal Reserve executes benchmark interest rate hikes via the Federal Open Market Committee (FOMC). These rate hikes immediately push up the benchmark Prime Rate, causing 30-year mortgage rates, revolving credit card APRs, and auto loan financing costs to explode for American consumers.
1. Demystifying the US PPI Report: The Early Warning Radar for Consumer Inflation
Why wholesale prices dictate tomorrow's retail reality and why the Federal Reserve monitors it relentlessly
To comprehend why everyday costs continue to surprise American households, one must first recognize the fundamental difference between the two primary inflation metrics published by the US Bureau of Labor Statistics (BLS): the Consumer Price Index (CPI) and the Producer Price Index (PPI). While the CPI measures the price changes paid directly by urban consumers for a representative basket of final goods and services, the PPI measures inflation from the perspective of the seller. It captures the revenue received by domestic producers for their output across goods, services, and construction.
Think of the American economy as an industrial assembly line that spans thousands of miles. At the head of the line are mining operations extracting copper, agricultural operations harvesting grain, petrochemical refineries producing ethylene for plastics, and timber mills curing lumber. In the middle of the line are parts fabricators, food processing facilities, and packaging manufacturers. At the very end of the line sits your local supermarket, home improvement center, auto dealership, or doctor's office.
The Consumer Price Index only measures the temperature at the very end of the conveyor belt. When the BLS reports that CPI rose 3.4% year-over-year, it is telling you what already left your wallet last month. The Producer Price Index, by stark contrast, measures the temperature at the beginning and middle of the conveyor belt. When wholesale input costs for diesel freight, packaging corrugated cardboard, or food grain surge by 5% in March, those costs do not magically evaporate into thin air. Modern corporate accounting operates on profit margin preservation. Producers pass cost increases to distributors, distributors pass them to retail conglomerates, and retail conglomerates update the digital price tags on store shelves.
Crucially, the monthly PPI report breaks down inflation into distinct, illuminating tiers that give economists and consumers an unmatched diagnostic view of the economic engine:
• PPI Final Demand: Measures price changes for commodities and services sold directly to final consumers, government entities, and capital investment buyers. This represents the final wholesale gate before retail shelves.
• PPI Intermediate Demand: Measures price changes for goods, services, and maintenance flows sold to other businesses as inputs for further processing. This is divided into Stage 4 (near completion), Stage 3 (semi-processed), Stage 2 (basic components), and Stage 1 (crude raw materials).
• Core PPI (Excluding Food, Energy, and Trade Services): Because global crude oil benchmarks and agricultural commodity prices fluctuate wildly based on geopolitical turmoil and weather events, the Federal Reserve pays supreme attention to 'Core PPI'. Stripping out these volatile components reveals the underlying structural trend of industrial and service-sector pricing pressure.
| Economic Characteristic | Producer Price Index (PPI) | Consumer Price Index (CPI) | Consumer Significance |
|---|---|---|---|
| Primary Measurement Point | Wholesale & Producer Revenue Gate | Retail Cash Register & Final Consumer Checkout | PPI moves first; CPI follows with a 60–90 day lag. |
| Publishing Agency | US Bureau of Labor Statistics (BLS) | US Bureau of Labor Statistics (BLS) | Both are official US Department of Labor monthly benchmarks. |
| Timing in Economic Pipeline | Leading Indicator (Upstream Input Costs) | Lagging Indicator (Downstream Final Prices) | PPI spikes alert consumers to prepare for higher living costs ahead. |
| Scope of Coverage | Goods, Services, and Construction output | Urban household out-of-pocket consumer spending | PPI includes capital goods and industrial equipment omitted from CPI. |
| Federal Reserve Weight | High predictive weight for future inflation modeling | Statutory headline metric for consumer purchasing power | A hot PPI report guarantees more hawkish FOMC rate decisions. |
| Corporate Response | Direct indicator of corporate margin compression | Direct indicator of consumer demand resistance | Companies raise prices when PPI outpaces retail price flexibility. |
2. The Transmission Pipeline: How a Wholesale Price Hike Becomes a Fed Rate Hike
Tracing the cascading 4-step conduit from factory floor to your family checking account
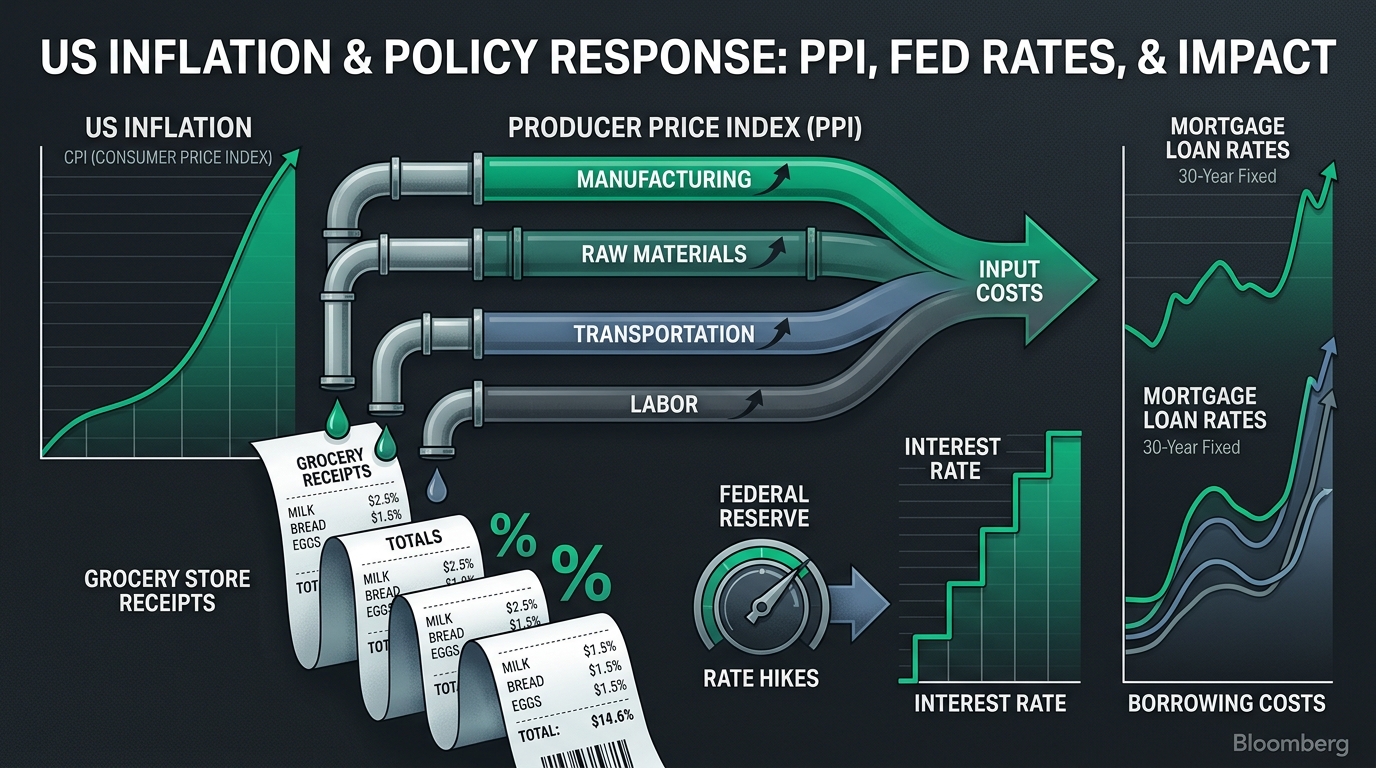
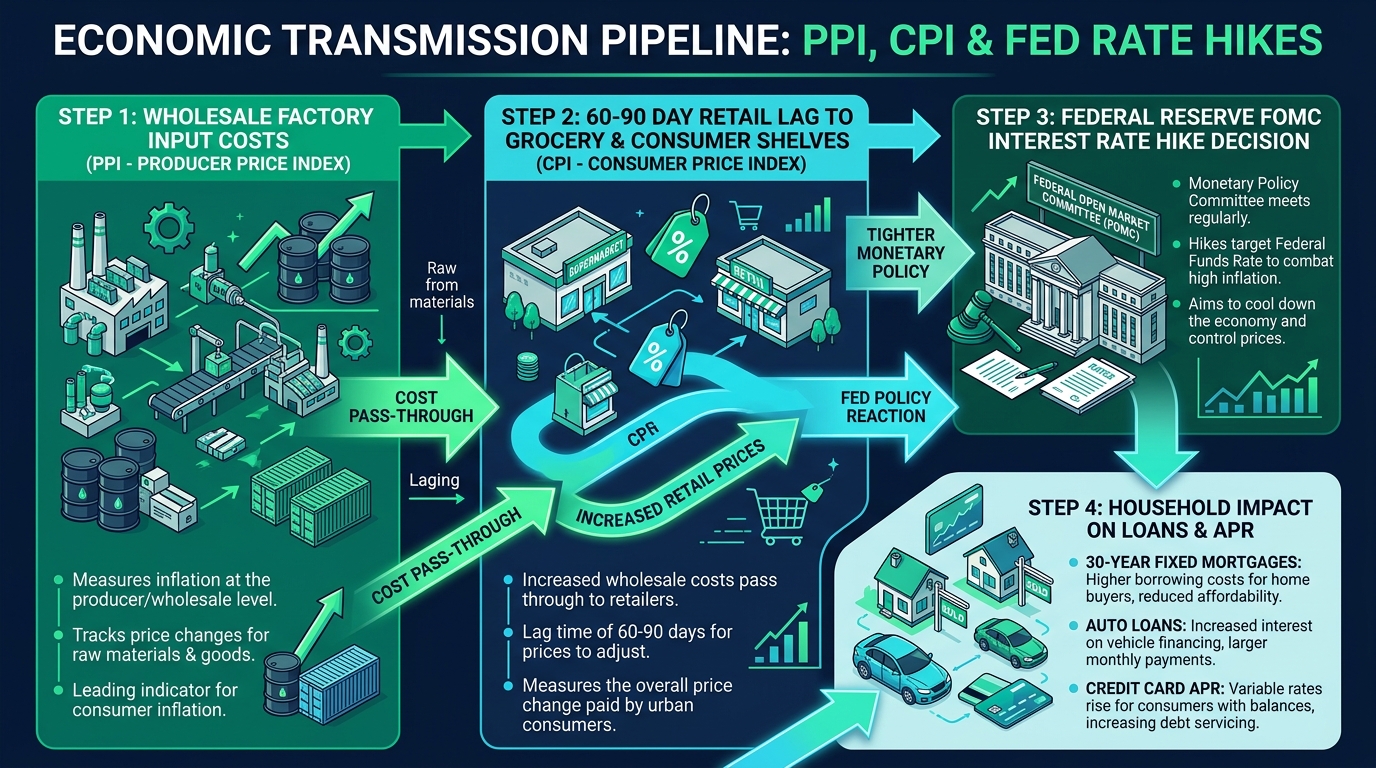
Understanding macroeconomics requires looking past isolated news flashes and seeing the unified chain reaction that connects global wholesale commodities to your monthly bank statement. Inflation does not exist in a vacuum; it flows through a rigid, predictable institutional conduit.
When an unexpected heatwave damages Midwest crops, or geopolitical conflict in the Middle East chokes shipping routes through the Suez Canal, insurance underwriters raise maritime freight rates and energy producers raise diesel prices. In the Bureau of Labor Statistics data rooms, this initial shock registers as a spike in the PPI Intermediate Demand indices. Industrial manufacturers that convert petrochemicals into food containers or pharmaceutical blister packs suddenly face a 6% increase in raw material costs.
Because corporate management is legally bound to maximize shareholder returns and maintain operating margins, these manufacturing firms do not absorb these input costs. Instead, they renegotiate supply agreements with nationwide distributors and retail chains. This entire negotiation, shipping, and restocking cycle takes between 60 and 90 days. When current warehouse inventory is depleted and new inventory arrives at the higher wholesale price, retail shelf prices jump. Consumer Price Index (CPI) readings accelerate, consumer sentiment drops, and inflation expectations begin to unmoor from stability.
This is the exact moment the Federal Reserve steps onto the field. Established under the Federal Reserve Act with a statutory dual mandate from the United States Congress—to promote maximum employment and maintain price stability (defined as 2.0% annual inflation)—the central bank possesses only one primary sledgehammer: monetary policy through the Federal Funds Rate.
 AI Generated Image
The Prime Rate Transmission Mechanism
The Federal Reserve does not directly set the interest rate on your credit card, car loan, or mortgage. Instead, the FOMC sets the Federal Funds Target Range (the overnight lending rate between commercial banks). However, commercial banks instantly calculate the benchmark US Prime Rate using a hardwired formula: Prime Rate = Federal Funds Target Rate (upper bound) + 3.00%. The moment the Fed raises its benchmark by 25 basis points (0.25%), the Prime Rate increases by 0.25% the very next morning, instantly raising variable borrowing costs for tens of millions of American consumers.
3. Pain Point #1: The US Housing Freeze & The $1,000/Month Rate Hike Trap
Why today's 6.5%–7.5% mortgage rates feel catastrophically different than the 1980s and how buying power vanished
Nowhere is the painful reality of inflation-driven rate hikes more acute, or more economically devastating for everyday Americans, than in the residential real estate market. For an entire generation of American workers, homeownership has represented the primary engine of personal net worth, forced savings, and generational wealth building. Between 2010 and 2021, buyers grew accustomed to historic 30-year fixed mortgage rates fluctuating between 2.75% and 4.00%. When emergency stimulus and supply disruptions unleashed the greatest inflation wave in forty years, the Federal Reserve initiated the fastest monetary tightening cycle since the Volcker era of the early 1980s.
Within eighteen months, benchmark 30-year fixed mortgage rates surged from 3.0% to over 7.5%. Many older financial commentators carelessly dismiss modern buyer complaints by arguing: 'In 1981, mortgage rates were 18%! You should be grateful for 7%.' This comparison demonstrates a complete failure to understand basic affordability mathematics.
In 1981, when mortgage rates hovered between 14% and 18%, the median single-family home price in the United States was roughly $68,000, while the median household income was approximately $22,390. In other words, a home cost approximately 3.0 times annual household income. Today, the median sales price of an existing home in the US stands near $420,000, while median household income is approximately $75,000. Today's home prices trade at 5.6 to 6.5 times median household income. Combining historically elevated home price-to-income multiples with interest rates north of 6.8% creates a mathematical chokehold on household cash flow.
Consider the concrete mathematics of borrowing $380,000 on a standard 30-year fixed loan schedule across different interest rate cycles. The difference is not just an academic percentage point—it is a brutal, life-altering monthly drain on family finances:
| Mortgage Interest Rate | Monthly Principal & Interest (P&I) | Total Lifetime Interest Paid | Total Cost of $380,000 Loan | Required Income (28% Front-End DTI Rule) |
|---|---|---|---|---|
| 3.00% (2021 Pandemic Low) | $1,602 / month | $196,778 | $576,778 | $68,650 / year |
| 4.50% (Historical Decade Average) | $1,925 / month | $313,146 | $693,146 | $82,500 / year |
| 5.50% (Transitional Market) | $2,158 / month | $396,729 | $776,729 | $92,480 / year |
| 6.50% (Moderate Tightening) | $2,402 / month | $484,669 | $864,669 | $102,940 / year |
| 7.00% (Elevated Rate Climate) | $2,528 / month | $530,134 | $910,134 | $108,340 / year |
| 7.75% (Restrictive Peak Cycle) | $2,725 / month | $600,825 | $980,825 | $116,780 / year |
4. Pain Point #2: The Variable Debt Spiral: Credit Cards, HELOCs & Auto Loans
How an overnight Fed rate hike quietly drains bank accounts through compounding APR escalators
While mortgage rate shocks primarily impact active homebuyers and relocating workers, the secondary transmission mechanism of Federal Reserve rate hikes strikes every single American with revolving debt: credit cards, Home Equity Lines of Credit (HELOCs), and vehicle financing.
Unlike fixed-rate installment mortgages, modern consumer credit cards are almost exclusively variable-rate credit instruments. In the fine print of your cardholder agreement, your interest rate is explicitly defined as: APR = Prime Rate + Margin (Spread). The margin is fixed based on your credit score (typically between 11.99% and 18.99%), but the Prime Rate floats directly with the Federal Reserve's target. When the Fed executed 525 basis points of rate hikes to combat the post-COVID inflation outbreak, the average credit card APR in the United States skyrocketed from 14.6% to an unprecedented 22.8%—the highest rate recorded in over thirty years of Federal Reserve tracking.
For an American household carrying the average national revolving balance of $7,200, this rate spike represents a silent, predatory wealth transfer. At 14.6% APR, making the standard minimum payment of 2% of the balance requires approximately $88 per month in interest charges. At 22.8% APR, the exact same balance generates nearly $137 per month in pure finance fees. Over $580 per year disappears into banking interest charges with zero reduction in the underlying debt.
If that family continues making only the minimum required monthly payments, look at the devastating mathematical divergence:
• At 14.6% APR on $7,200: Total repayment time is 16 years and 4 months; total interest paid to the bank is $5,420.
• At 22.8% APR on $7,200: Total repayment time balloons to 24 years and 8 months; total interest paid to the bank surges to $13,680!
A simple 8.2% shift in the Federal Reserve's benchmark rate translates into over $8,200 in additional interest and adds more than eight full years of financial enslavement to a family's budget. And when households turn to Home Equity Lines of Credit (HELOCs) to pay off cards or renovate their properties, they encounter the same trap: variable borrowing costs that jumped from 4.0% to over 9.5% overnight.
Car buyers face an identical squeeze. The average price of a new vehicle in the US has climbed above $48,000, while average used car prices hover near $26,000. With 60-month auto financing rates climbing from 4.2% up to 8.5%–11.0% for prime borrowers (and over 18% for subprime borrowers), the average monthly car payment in America has surpassed $735 per month. Millions of consumers find themselves paying more for their vehicle note than they paid for rent a decade ago. Using Homecalpro's free Credit Card Payoff Calculator and Auto Loan Calculator allows you to map out aggressive principal paydown schedules, test balance transfer strategies, and eliminate high-cost debt before compounding fees destroy your budget.
5. Pain Point #3: The Grocery, Energy & Small Business Squeeze
Why grocery prices refuse to drop even when inflation slows and the dilemma facing American contractors
One of the most frequent and exasperated questions asked by American consumers is: 'If the news says inflation has fallen from 9% down to 3%, why aren't grocery prices dropping at the supermarket?' This widespread frustration stems from a fundamental confusion between two critical economic terms: disinflation versus deflation.
Disinflation means that the rate of price increases has slowed down—prices are still rising, but at a more manageable 2% to 3% annual clip instead of 9%. Deflation, on the other hand, means prices are actively falling. Central banks fight deflation aggressively because prolonged falling prices trigger corporate layoffs, wage freezes, and economic depression. Therefore, when government officials announce that 'inflation is cooling,' they are not promising that a gallon of whole milk or a dozen eggs will return to 2019 prices. The higher price level is permanently locked into the economic baseline.
And the reason grocery prices remain stubbornly elevated is rooted entirely in the Producer Price Index pipeline. To put a package of shredded chicken breast on a refrigerated supermarket shelf, dozens of intermediate producers must absorb cumulative price increases:
1. Fertilizer and Farm Equipment PPI: Natural gas feedstocks for nitrogen fertilizers surged, increasing grain production costs for livestock feed.
2. Diesel Freight & Transportation PPI: Long-haul refrigerated trucking companies face higher fleet insurance, equipment replacement costs, and fuel surcharges.
3. Food Processing & Industrial Electricity PPI: Food packing plants face higher state commercial power utility rates and manufacturing wages.
4. Corrugated Packaging & Plastic Film PPI: Packaging suppliers charge higher rates for wholesale cartons and protective seals.
When all four intermediate supply tiers rise simultaneously, the wholesale cost of producing that package of chicken increases permanently by $1.80. The retail grocer operating on razor-thin 1.5% to 2.5% net profit margins must pass that $1.80 directly to the consumer simply to avoid operating at a net loss.
This dynamic creates an acute crisis for America's self-employed contractors, remodelers, tradespeople, and small business owners. If you run a local residential plumbing or roofing company in Michigan or North Carolina, wholesale suppliers of copper piping, PVC fittings, asphalt shingles, and electrical conduit frequently issue price quotes that are valid for only 5 to 7 business days. If a contractor bids on a $25,000 home remodeling project in January and begins installation in April, a wholesale PPI spike can erase their entire profit margin before the final invoice is paid. Small businesses must utilize real-time price monitoring and automated margin calculators to ensure their project estimates reflect true replacement costs.
6. The Mathematical Rules of Inflation Defense: Real Returns vs. Nominal Illusions
Understanding purchasing power decay, the Fisher Equation, and why traditional savings accounts are guaranteed money losers
In a high-inflation, high-rate environment, the greatest threat to your family's financial security is not market volatility—it is mathematical complacency. Millions of Americans fall victim to the 'nominal illusion': the comforting feeling that because their savings account balance shows $20,000, their wealth has remained intact.
In economic reality, cash is not a store of static value; it is a depreciating asset whose purchasing power is constantly being eroded by the prevailing rate of inflation. To understand the true health of your savings and investments, you must evaluate every financial asset through the Fisher Equation, named after the classical American economist Irving Fisher:
Real Interest Rate = Nominal Interest Rate - Inflation Rate
If you hold $10,000 in a traditional brick-and-mortar bank checking or basic savings account earning 0.05% APY while the national inflation rate is running at 3.5%, your real economic return is not positive—it is a catastrophic -3.45% per year. Every twelve months, you lose $345 in real-world purchasing power. You can buy $345 fewer groceries, fewer gallons of gasoline, and fewer home goods with that exact same stack of ten thousand dollars.
The mathematical formula governing the destruction of purchasing power over time is defined by compound decay: Purchasing Power = P / (1 + r)ⁿ, where P is your principal, r is the annual rate of inflation, and n is the number of years. The following data matrix illustrates how sustained inflation stealthily confiscates the purchasing power of an uninvested $10,000 cash balance:
| Time Horizon | Purchasing Power at 3.0% Inflation | Purchasing Power at 5.0% Inflation | Purchasing Power at 7.0% Inflation | Cumulative Wealth Destruction (at 5%) |
|---|---|---|---|---|
| 1 Year | $9,709 | $9,524 | $9,346 | -$476 (-4.8%) |
| 3 Years | $9,151 | $8,638 | $8,163 | -$1,362 (-13.6%) |
| 5 Years | $8,626 | $7,835 | $7,130 | -$2,165 (-21.7%) |
| 10 Years | $7,441 | $6,139 | $5,083 | -$3,861 (-38.6%) |
| 15 Years | $6,419 | $4,810 | $3,624 | -$5,190 (-51.9%) |
| 20 Years | $5,537 | $3,769 | $2,584 | -$6,231 (-62.3%) |
7. The Strategic Action Plan: 6 Concrete Financial Moves for American Families
Field-tested playbooks to turn macroeconomic volatility into household financial resilience
Macroeconomic headlines about the Producer Price Index, consumer inflation spikes, and Federal Reserve meetings often leave everyday people feeling helpless. You cannot single-handedly control the global price of crude oil, you cannot dictate Federal Open Market Committee rate decisions, and you cannot force grocery chains to lower retail prices. But you have absolute, 100% control over how your household structures its debt, allocates its cash, and prepares for upcoming economic headwinds.
Here are six concrete, high-leverage defensive actions every American consumer should implement today:
- 1. Stress-Test Every Variable Debt Instrument: Conduct a forensic audit of your credit card statements, HELOC agreements, and adjustable-rate loans. Calculate your exact interest outflow at current rates and run worst-case scenarios with another 50 to 100 basis points of rate increases. Use Homecalpro's Credit Card Payoff Calculator to commit to aggressive fixed-principal payoff sprints rather than paying revolving minimums.
- 2. Evacuate Lazy Bank Deposits: Leaving emergency cash reserves in a major national bank account yielding 0.01% to 0.05% APY is voluntary financial self-harm. In a 5.0% benchmark interest rate environment, high-yield savings accounts (HYSAs), certificates of deposit (CDs), and 4-week to 26-week US Treasury Bills pay 4.5% to 5.2% annualized with zero market risk. A $25,000 emergency fund moved from 0.02% to 4.85% APY generates over $1,200 in guaranteed annual interest income.
- 3. Audit Your True Take-Home Pay with the Salary Calculator: As inflation increases the cost of health insurance premiums, commuting costs, and state sales taxes, your real net disposable income shrinks even if you received a 3% nominal raise. Use Homecalpro's Salary Calculator to calculate your true post-tax, post-deduction hourly and monthly cash flow to establish realistic household spending caps.
- 4. Enforce the 28/36 Housing Affordability Rule: If you are currently shopping for residential real estate, never allow a mortgage loan officer or real estate broker to dictate your budget ceiling. Underwrite yourself conservatively: ensure your total monthly PITI payment remains under 28% of your gross monthly income, and total debt service remains below 36%. If current mortgage rates push you past 36%, expand your down payment, look in more affordable sub-markets, or wait for better entry points.
- 5. Adopt Wholesale Food & Energy Hedging at Home: Corporate procurement managers hedge input costs by buying in bulk when supply pipelines indicate future price hikes. Adopt the same mindset: buy non-perishable staples in volume when discounted, review home energy efficiency ratings, and lock in service contracts before seasonal demand cycles push labor rates higher.
- 6. Automate Long-Term Compound Equity Investing: Over long historical horizons (10, 20, and 30 years), diversified equities (such as S&P 500 and total stock market index funds) have generated average annualized returns of 9% to 10%, far outpacing average consumer inflation of 3.0% to 3.5%. Automating fixed monthly contributions via dollar-cost averaging turns market dips into high-value accumulation phases.
8. Exploring Homecalpro's Free Defensive Calculator Suite
Zero-knowledge, 100% private client-side computational tools designed to protect your wallet
At Homecalpro, we believe that access to accurate, institutional-grade financial mathematics should be completely free, instant, and private. Unlike traditional financial websites and lead-generation lending portals that demand your name, email address, phone number, and Social Security number to sell your personal information to third-party mortgage brokers and telemarketers, Homecalpro runs 100% of calculations directly in your browser.
Your financial data never touches an external server, is never stored in a remote database, and is never monetized. Here are the core defensive tools every American consumer should keep bookmarked during this inflation and rate hike cycle:
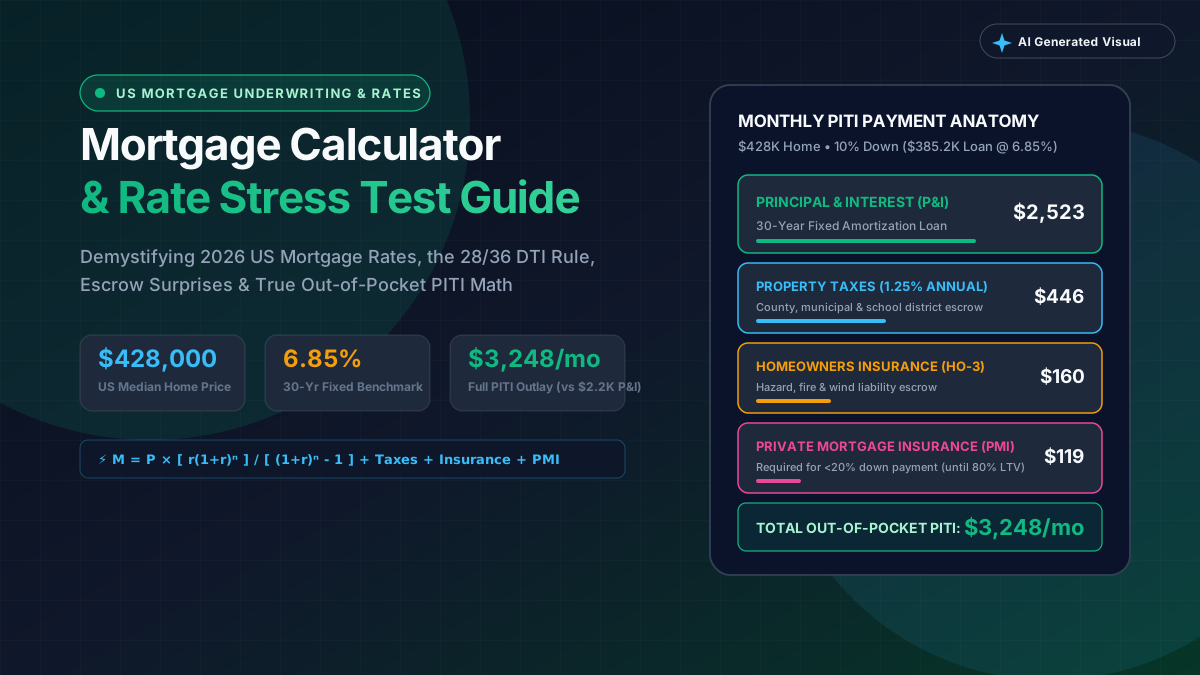
• Mortgage Calculator (PITI): Accurately computes true monthly homeownership payments, factoring in principal amortizations, current market interest rates, county property taxes, hazard insurance escrows, HOA dues, and private mortgage insurance (PMI) thresholds.
• House Affordability Calculator: Evaluates your gross household income, monthly debt obligations, and down payment funds against strict 28/36 underwriting guidelines, giving you a safe, conservative maximum purchase ceiling.
• Credit Card Payoff Calculator: Models accelerated debt elimination schedules. Enter your current balance, variable APR, and target monthly payment to see exact payoff dates, total interest saved, and comparative debt avalanche metrics.
• Auto Loan Calculator: Calculates exact monthly vehicle notes, lifetime interest costs, and trade-in equity impacts across 36, 48, 60, and 72-month terms before you walk into a dealership finance office.
• Compound Interest Calculator: Projects the growth of your high-yield savings and investment portfolios over time with customizable monthly contributions, compound frequencies, and inflation-adjusted real return benchmarks.
• Salary & Take-Home Pay Calculator: Calculates net disposable income after federal taxes, FICA (Social Security and Medicare), state income taxes, and pre-tax benefit deductions.
Client-Side Zero-Knowledge Privacy Guarantee
Every tool in the Homecalpro directory operates client-side. Whether you are analyzing a $500,000 mortgage application, testing a $15,000 credit card debt elimination plan, or computing your exact annual take-home salary, your financial inputs remain entirely on your own local device.
Frequently Asked Questions
Click any question below to expand quick answers, formulas, and expert tips.
What is the US PPI report and why does it matter to everyday consumers?
The Producer Price Index (PPI) report, published monthly by the US Bureau of Labor Statistics (BLS), measures the average change over time in selling prices received by domestic producers for their output. It matters directly to everyday consumers because it serves as the primary leading indicator of retail inflation. When wholesale producers face higher input costs for raw materials, manufacturing, energy, and transportation, they pass those cost increases down the supply chain to retailers, which leads to higher retail shelf prices (CPI) approximately 60 to 90 days later.
How does a hot PPI report trigger a Federal Reserve interest rate hike?
The Federal Reserve is mandated by Congress to maintain price stability, targeting a 2.0% annual inflation benchmark. When the monthly PPI report reveals persistent, above-target wholesale price increases, it signals to the Federal Open Market Committee (FOMC) that consumer inflation will remain elevated in the coming quarters. To prevent an inflationary spiral, the Fed responds by raising its benchmark Federal Funds Rate, making business and consumer borrowing more expensive in order to cool aggregate economic demand.
How do Federal Reserve rate hikes affect current 30-year fixed mortgage rates?
While the Federal Reserve does not set 30-year mortgage rates directly, mortgage lenders price long-term fixed loans primarily off the yield of 10-Year US Treasury bonds, plus an industry risk spread (typically 1.7% to 2.5%). When the Fed raises rates or signals that inflation remains high, bond yields rise, pushing 30-year fixed mortgage rates higher. Every 1.0% increase in mortgage rates increases the monthly payment on a standard $400,000 loan by approximately $260 to $280 per month, drastically eroding buyer purchasing power.
Why do credit card interest rates jump immediately when the Fed hikes rates?
Nearly all consumer credit cards have variable annual percentage rates (APRs) tied directly to the US Prime Rate, which is defined as the Federal Funds Rate + 3.00%. When the Fed hikes benchmark rates by 25 basis points (0.25%), the Prime Rate increases by the exact same amount the following business day. Credit card issuers automatically pass this rate increase to cardholders within one to two billing cycles, causing monthly interest charges to compound faster on revolving debt.
What is the difference between disinflation and deflation?
Disinflation refers to a slowing in the rate of inflation—prices are still rising, but at a slower pace (e.g., rising by 3% annually instead of 8%). Deflation, by contrast, is an actual decrease in the general price level where goods and services become cheaper over time. Central banks strive for low, predictable disinflation toward 2% because widespread deflation often accompanies severe economic contractions, rising unemployment, and declining business revenues.
How can I protect my emergency savings from losing purchasing power during inflation?
To prevent inflation from eroding your purchasing power, avoid leaving surplus emergency savings in standard brick-and-mortar bank accounts yielding 0.01% to 0.05% APY. Instead, deposit your 3-to-6-month emergency reserves into High-Yield Savings Accounts (HYSAs), Treasury Inflation-Protected Securities (TIPS), or short-term US Treasury Bills (T-Bills) yielding between 4.5% and 5.2%. This ensures your cash earns a return that partially or fully offsets annual inflation.
How does inflation create 'bracket creep' on federal income taxes?
Bracket creep occurs when inflation pushes workers into higher nominal income tax brackets or phases them out of tax deductions and credits, even though their real purchasing power has not increased. Although the IRS adjusts tax bracket thresholds and standard deductions annually for inflation using Chained CPI, state income taxes and localized municipal tax caps often lag, resulting in higher overall tax burdens for households that received cost-of-living raises.
How does Homecalpro's Mortgage Calculator help me navigate high-rate environments?
Homecalpro's Mortgage Calculator computes your full monthly housing obligation (PITI: Principal, Interest, Taxes, and Insurance) rather than just raw loan amortization. In high-rate environments, it allows you to test realistic rate hike scenarios, calculate the exact cost of Private Mortgage Insurance (PMI), evaluate down payment thresholds, and see how extra monthly principal payments can shorten a 30-year loan by a decade and save tens of thousands of dollars in lifetime interest charges.
The Bottom Line
Economic headlines about the US PPI report, inflation indices, and Federal Reserve rate hikes can feel overwhelming, but you do not have to navigate this economic cycle blind. By understanding how wholesale price shocks flow through consumer credit and mortgage rates, stress-testing your household debt with free client-side tools, and optimizing your savings and cash flow, you can protect your family's financial future. Run your real numbers today with Homecalpro's free suite of 241+ zero-knowledge online calculators.
This article is for informational and educational purposes. Always verify complex calculations with a qualified professional or official documentation.